My objects are aging too fast
A couple weeks ago we were making some performance tests in a legacy java component, in preparation for a week of expected high load. We wanted to find problems that may cause the services to fail during this important period so we could be prepared and preemptively perform some mitigation actions. We were not familiar with the inner workings of the service, there were few metrics available and it had never been closely monitored under this kind of load, so we had some work ahead.
At high level the service’s job was not too complex, it received messages from multiple rabbitMQ queues, did some processing over the data and finally published the result to an outbound rabbitMQ exchange and different Kafka topics.
What did we observe?
When the load started to increase the machines' free memory was steadily going down. The first instinct was to think it was some kind of memory leak, thus we decided to get an heap dump.
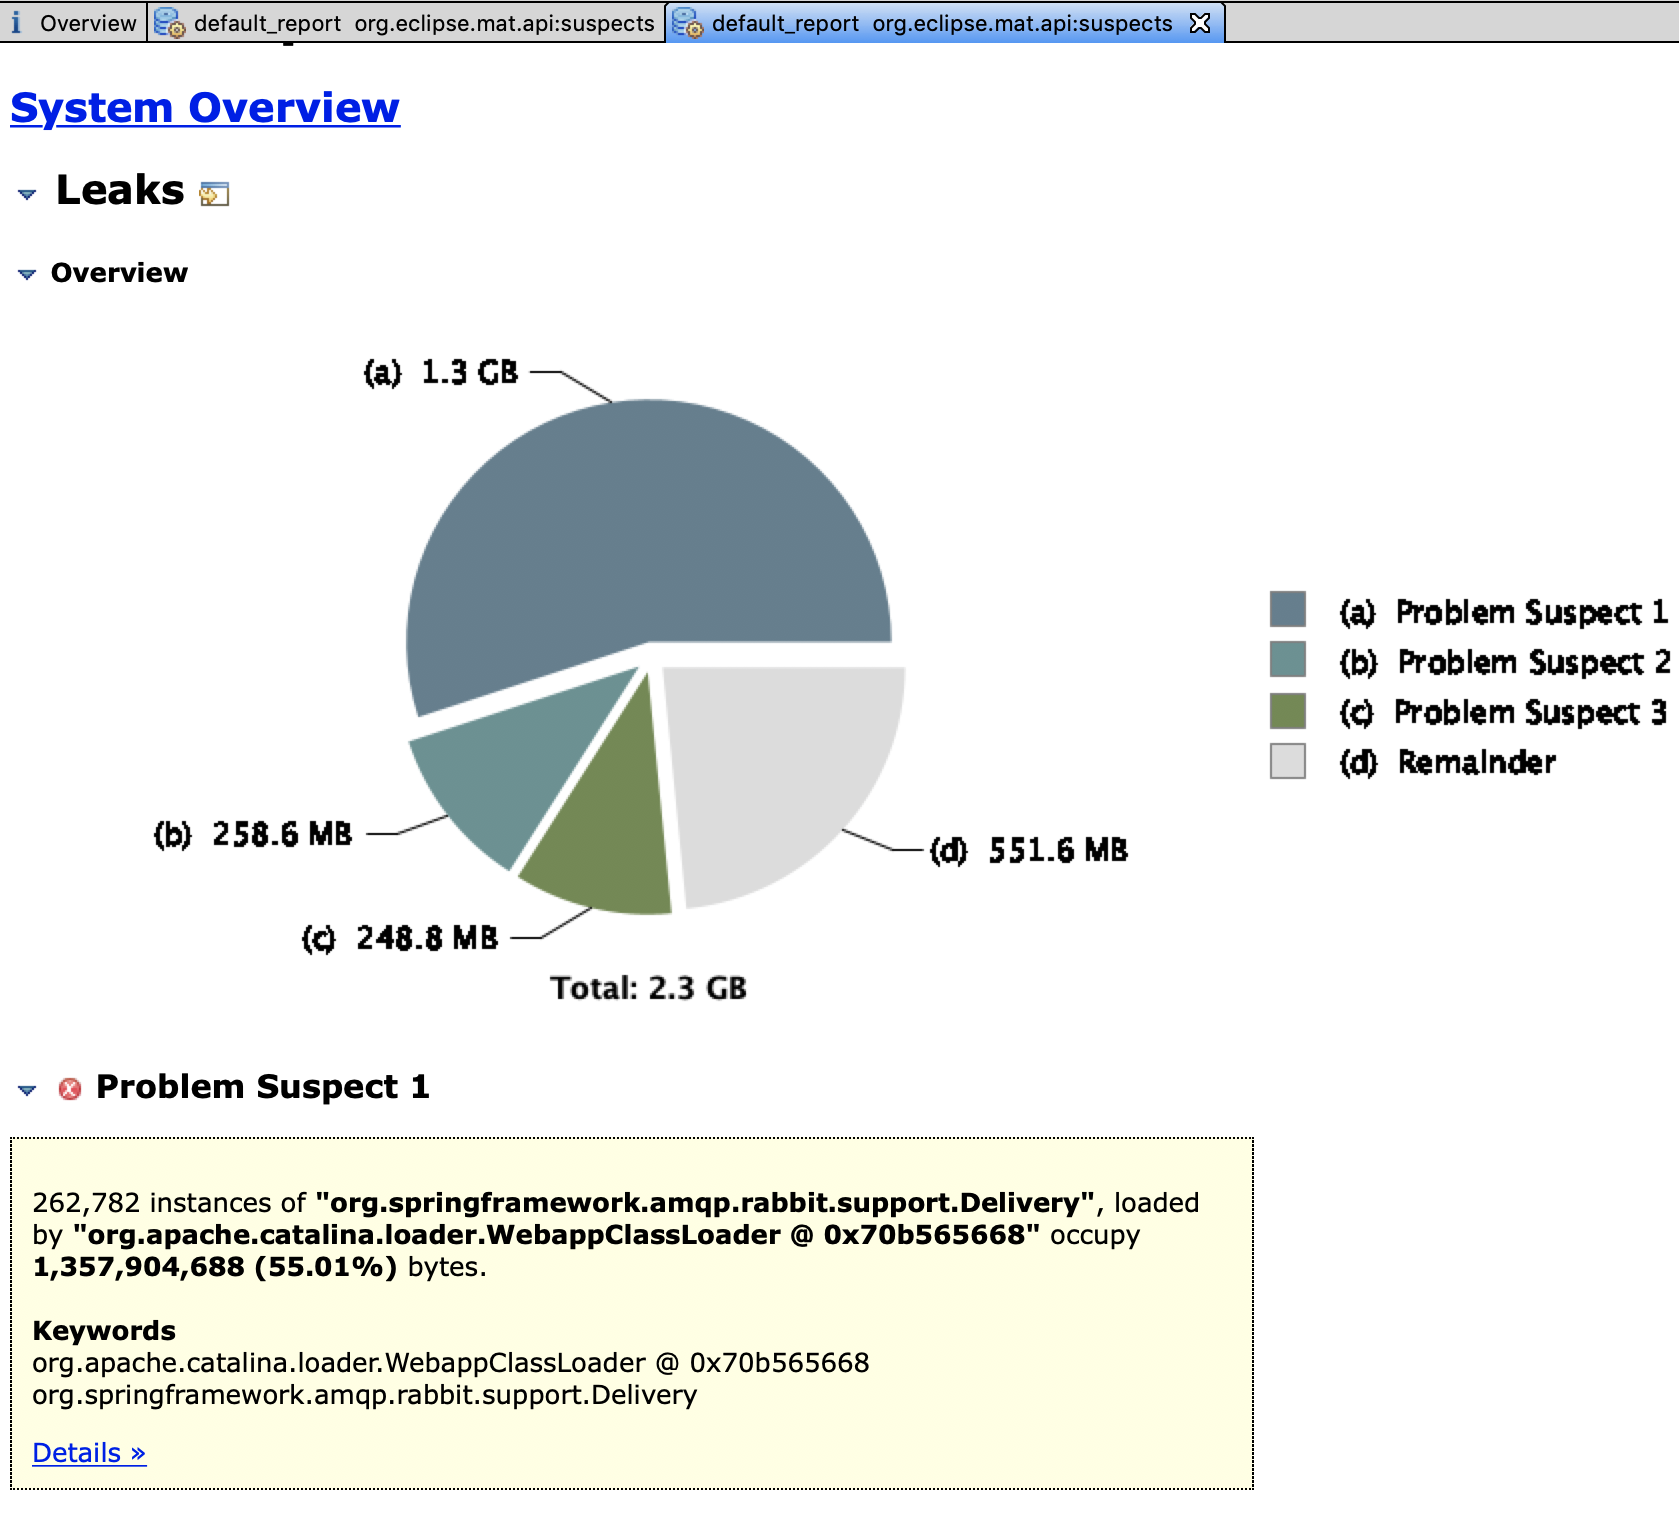
Heap memory was growing and we discovered that the a big chunk of memory was being hold by unreachable objects that were not being clean fast enough, or at all, by the Garbage Collector. The culprit taking 1.3GB of the heap when the snapshot was taken was org.springframework.amqp.rabbit.support.Delivery, the object wrapping rabbitMQ messages reaching the system.
After closely looking into the memory pool usage graph we found that oldGen was unexpectedly growing at a higher rate than expected and minor garbage collection cycles were really small. We’ll see what that means in a second.
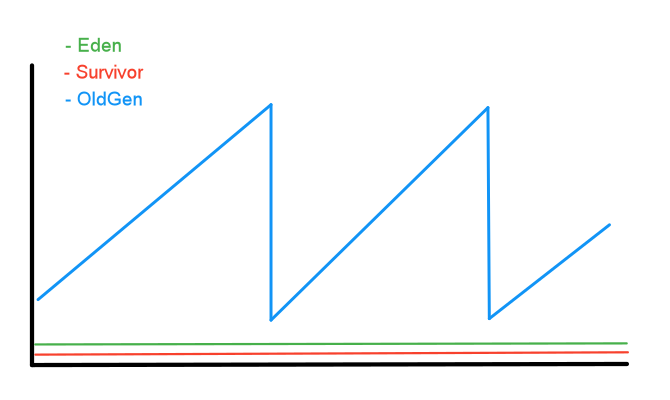
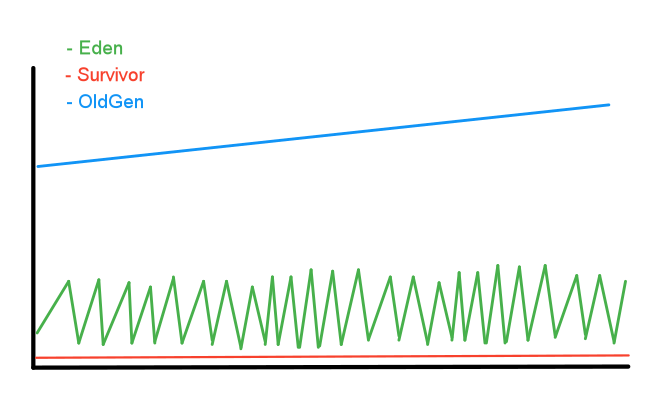
It seems that both eden and survivor spaces don’t change at all, but they do. The problem is that the scale is very different. Looking into a tiny section of the graph we can see the behavior of eden space and that survivor space changes are still too small to be displayed.
How does GC work? (a quick overview)
The JVM divides the heap memory into two spaces, Young Generation and Old Generation (or Tenured). youngGen is where objects that have been recently created are allocated and is further subdivided into 3 spaces: eden space, survivor space 1 and survivor space 2.
By default, eden is bigger than the two survivor spaces combined. Also, both survivor spaces have exactly the same size and only one can contain objects at a time.
When a new object is created it is allocated in eden. When eden space is full, a minor garbage collection is triggered. When this happens
-
All objects inside youngGen (eden and survivor with objects) are quickly inspected to check their eligibility for garbage collection.
- The unreachable ones, i.e. the ones that aren’t referenced from other objects, are marked as dead and garbage collected.
- The others, the surviving ones, are moved to the empty survivor space.
The objects life-cycle is: [eden, survivor 1] -> [eden, survivor 2] -> [eden, survivor 1]
-
Objects that have survived many minor GCs, i.e. that have jump between survivor spaces enough times, reach the maximum tenuring threshold and are moved to oldGen.
-
If there isn’t enough room in the empty survivor space to receive the surviving objects, both from eden and the other survivor space, they are prematurely pushed to oldGen.
When oldGen occupancy rate or heap free memory reach some defined threshold, a major garbage collection is triggered which inspects all objects in oldGen and cleans the unreachable ones.
What was happening?
The service was receiving messages from rabbitMQ queues. These messages were buffered on the service side while waiting to be picked for processing, filling the rather small eden space. Processing was not able to keep up with the demand and messages weren’t consumed fast enough, leading to most of these objects, that should be short-lived, being still active when the minor GC ran.
Survivor space, smaller than eden, couldn’t fit all the surviving objects, leaving no choice to minor GC but to prematurely push everything that did not fit into oldGen. When these objects were finally processed and became ready to be garbage collected, they were already living in oldGen space and thus, not clean until a major GC was triggered.
After closer observation, we noticed that even in situations of lower input pressure the same problem was happening although at a lower rate. So probably the problem was not that the system had a poor back-pressure mechanism and could not control the flow of incoming messages but rather that eden space wasn’t adequate to handle the accumulated message batch size it was receiving from the multiple inbound queues.
What did we do?
The quick solution seemed obvious, we just needed to make eden space bigger. First we looked into the run script to check which JVM flags were we setting.
-Xms3G
-Xmx3G
-XX:PermSize=128m
-XX:MaxPermSize=128m
-XX:+UseConcMarkSweepGC
-Xss512K
The script was setting 3GB of heap memory and using Concurrent Mark-Sweep Collector (CMS), one of the garbage collector implementations available on the JVM. We decided to experiment with different ratios, changing -XX:NewRatio and -XX:SurvivorRatio flags, trying to get a more adequate partitioning of memory, but we were not getting the expected results.
After a bit more digging we looked into the JVM source code to understand why were we getting the unexpected results. This is what we found out.
// Adjust some sizes to suit CMS and/or ParNew needs; these work well on
// sparc/solaris for certain applications, but would gain from
// further optimization and tuning efforts, and would almost
// certainly gain from analysis of platform and environment.
void Arguments::set_cms_and_parnew_gc_flags() {
  ...
  const size_t preferred_max_new_size_unaligned =
    MIN2(max_heap/(NewRatio+1), ScaleForWordSize(young_gen_per_worker * parallel_gc_threads));
When -XX:+UseConcMarkSweepGC is set the JVM makes its own adjustments to the heap partitioning to suit the CMS garbage collector based on the parallel_gc_threads and young_gen_per_worker. We checked these values on the machine running our service and it showed different values than the ones set on our test machine. Completely oblivious of this behavior we were getting sizes much lower than expected.
$ java -XX:+UnlockDiagnosticVMOptions -XX:+PrintFlagsFinal -version | egrep -i "(ParallelGCThreads|CMSYoungGenPerWorker)"
    uintx CMSYoungGenPerWorker                      = 67108864 (64MB)                     {pd product}
    uintx ParallelGCThreads                         = 2                                   {product}

$ jmap -heap 19178
Heap Configuration:
   MinHeapFreeRatio         = 40
   MaxHeapFreeRatio         = 70
   MaxHeapSize              = 3221225472 (3072.0MB)
   NewSize                  = 174456832 (166.375MB)
   MaxNewSize               = 174456832 (166.375MB)
   OldSize                  = 3046768640 (2905.625MB)
   NewRatio                 = 2
   SurvivorRatio            = 8
   MetaspaceSize            = 21807104 (20.796875MB)
   CompressedClassSpaceSize = 1073741824 (1024.0MB)
   MaxMetaspaceSize         = 17592186044415 MB
   G1HeapRegionSize         = 0 (0.0MB)
We considered 2 more options to fix this issue
Manually increase youngGen’s size via an explicit JVM flag.- Use a different machine with more CPUs.
- Change Garbage Collector.
The second option was almost immediately discarded. We would need to deploy the application to another set of machines. Besides not knowing the service well enough, it was running in an old infrastructure that is not easy to maintain and usually a source of problems. In the end it was not feasible and there were easier solutions.
The most sensible option seemed to be the third one. Instead of continuing to try to find a NewRatio and SurvivorRatio that made sense, being constrained by the JVM internal optimizations and possibly, due to the low number of GC threads, experience long GC pauses, we decided to test a different Garbage Collector. Also, CMS is deprecated and already removed in newer versions of the JDK, thus users are encouraged to migrate to the G1 collector.
We removed -XX:+UseConcMarkSweepGC and configured the JVM to use G1 Garbage Collector by setting the flag -XX:+UseG1GC.
After running some more tests, this approach appears to work as expected.
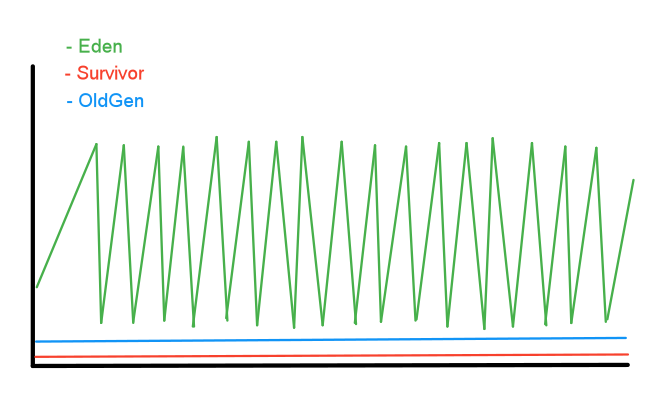
youngGen’s size is considerably bigger which makes _minor GC_s less frequent, allowing the service to process the message objects and release them to be cleaned before going through to oldGen. Analyzing the data now shows that we can keep oldGen at around 90-100MB throughout the application life.
In conclusion, increasing the size of youngGen lead to a significant decrease in objects needing to be copied to survivor spaces, reduced the frequency of major GCs and the overall GC duration, improving the service throughput during higher load periods and keeping the memory footprint lower.