A leaking queue
Everything was running smoothly when we left for the weekend. Monday morning we got back and we had multiple alerts waiting for us, one of our java applications was misbehaving… Thankfully it was a test environment and changes had not yet been released to production :).
Investigation
Looking at the dashboards we noticed garbage collection (GC) taking too much time and abnormal CPU usage on some hosts. After going through the logs for more information we found
java.lang.OutOfMemoryError: GC overhead limit exceeded
This error is raised when the GC is taking most of the machine’s CPU time (98% by default) and recovers very little heap memory after each run (less than 2%). The machine CPU usage was showing values around 772%, almost max capacity (at an 8 core machine - 100% per core when fully used).
For out of memory issues, there are two possible reasons, or the memory settings for the JVM are not correctly configured, or the application have a memory leak.
The first type is normally easy to fix by changing some JVM settings. The second type can be a bit trickier as we need to find where the leak is and fix the code. And in this case we were facing a problem of the second type.
What could be causing this leak?
We thought that looking into the heap current state might be a good idea, so we dumped it to a file in the server and transferred it to our local machine (~2GB) for analyses.
// remote
$ jmap -dump:format=b,file=heap_dump.hprof <app pid>
// local
$ scp user@<hostname>:<remote path to heap_dump.hprof> <local path>
We opened the file with the MAT java profiler.

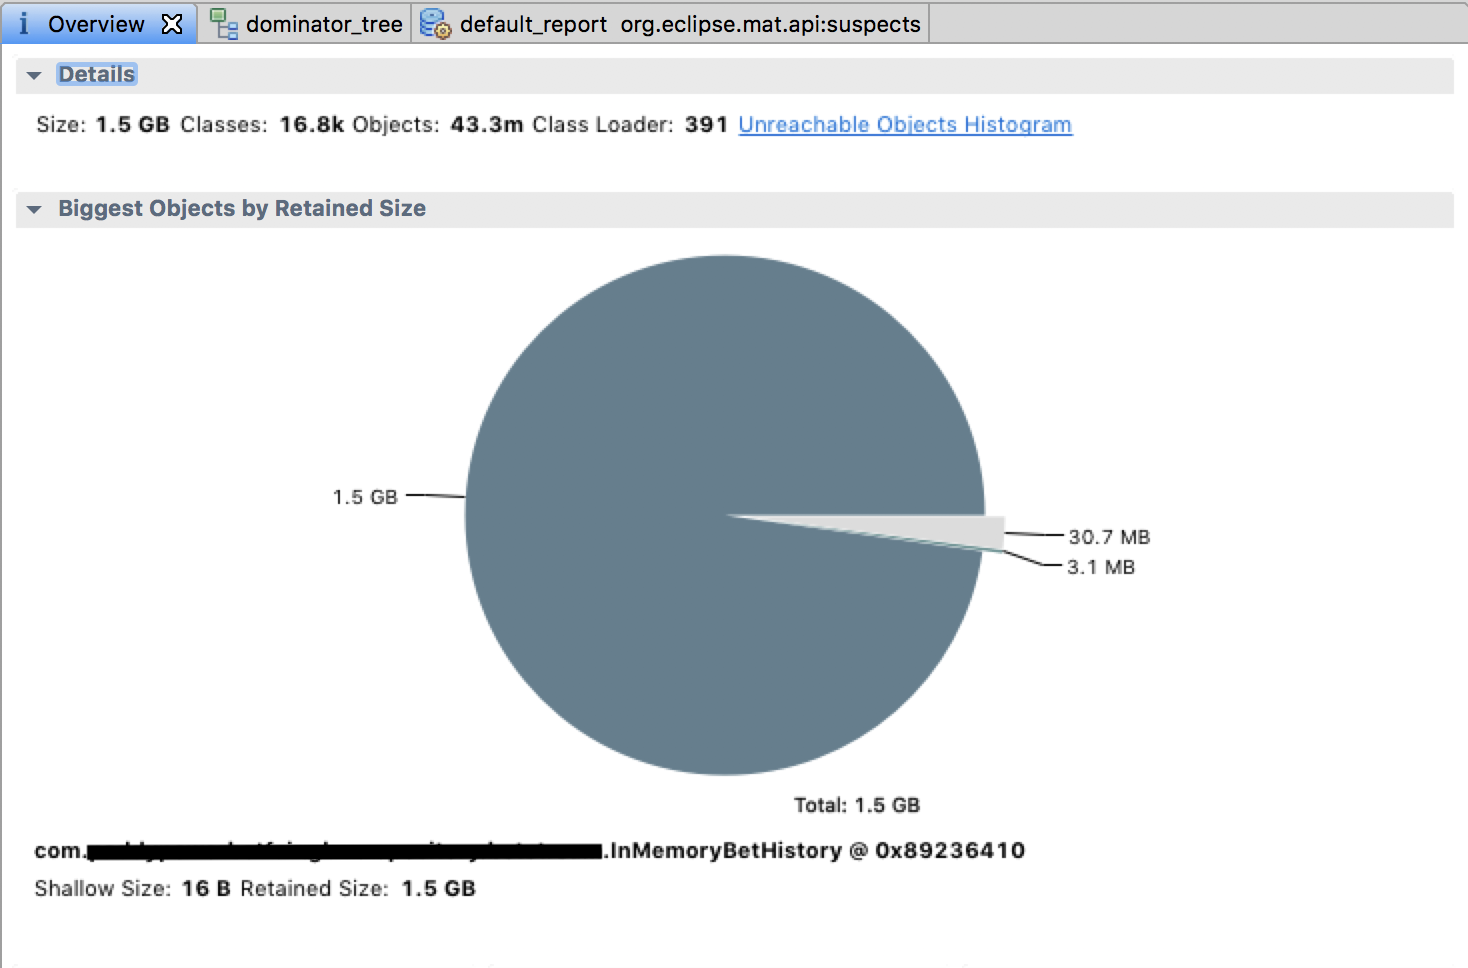
With this tool we quickly identified the class that was causing the problem (taking 1.5GB of heap memory, which was not supposed to be happening :P). For a closer look we opened the dominator tree where we could see all the objects that were alive in the JVM and which ones were taking more heap space along with the all reference chain.

With this we found the exact place causing the memory leak. The offender class was named ConcurrentEvictingBuffer that wrapped a ConcurrentLinkedDeque which was taking 97.79% of the heap memory, maintaining far more nodes than expected. At some point it reached more than 113k queued objects.
Next step was to look into the code to find what could be the source of this bug. ConcurrentEvictingBuffer was a concurrent FIFO with a maximum of n elements, i.e. it took elements up to n and after that, when asked to push yet another element, the queue head was removed, thus keeping the same size of n elements.
public class ConcurrentEvictingBuffer<E> extends ForwardingDeque<E> implements Serializable {
    private final Deque<E> delegate;
    private final int maxSize;

    private ConcurrentEvictingBuffer(int maxSize) {
        checkArgument(maxSize >= 0, "maxSize (%s) must >= 0", maxSize);
        this.delegate = new ConcurrentLinkedDeque<>();
        this.maxSize = maxSize;
    }

    /**
     * Returns the number of additional elements that this queue can accept without evicting;
     * zero if the queue is currently full.
     */
    public int remainingCapacity() {
        return maxSize - size();
    }

    //...

    /**
     * Adds the given element to this queue;
     * If the queue is full, the element at the head is evicted.
     */
    @Override
    public boolean add(E e) {
        checkNotNull(e);
        if (maxSize == 0) return true;
        if (size() == maxSize) delegate.remove();
        delegate.add(e);
        return true;
    }

    //...
}
It all seemed ok, the behavior was all tested and the tests were all passing. However, after some investigation, we found that we had a concurrency problem. When multiple threads tried to add a new element at the same time we were not safely checking if the queue had already reached the maximum size so we could remove the oldest element.
if (size() == maxSize) delegate.remove();
In a situation where size() == maxSize, this is what could happen
[thread-1] if (size() == maxSize) // true
[thread-1] delegate.remove()
[thread-2] if (size() == maxSize) // false
[thread-2] delegate.add(e);
[thread-1] delegate.add(e);
This sequence would end up in size() == maxSize + 1. Although this could have a low probability of occurring, it only needed to happen once to get us in a state were we would never recover, as from that point on the queue would never delete any element again because size() > maxSize, making the queue grow forever.
Actions
The Heap dump analysis was essential to give us important information about what was happening in the JVM and point us in the right direction to solve the problem. With the target narrowed down into a single class it was not too long before we found the problem and fixed it.
The fix itself was the easy part. While at it we decided to do a small refactor in order to simplify code readability and future understanding. We removed a layer of abstraction and directly used the ConcurrentLinkedDeque on the class that was depending on the custom ForwardingDeque implementation.
public class InMemoryHistory implements History {

    private final Deque<Event> history;
    private final int maxSize;
    private final AtomicLong count;

    public InMemoryHistory(Properties properties) {
        this.history = new ConcurrentLinkedDeque<>();
        this.maxSize = properties.history().getMaxSize();
        this.count = new AtomicLong();
    }

    @Override
    public void save(Event event) {
        checkNotNull(event);
        if (maxSize == 0) return;
        if (count.getAndIncrement() >= maxSize) history.remove();
        history.add(event);
    }

    @Override
    public Stream<Event> stream() {
        return asStream(history.descendingIterator());
    }
}